The Biophysics of Gene Regulation and Consequences for Genome Organization
One of the earliest observations in molecular biology was that the order of genes on the chromosome of E. coli is not random: while studying the lac system, Jacob and Monod noted that all of the metabolic genes E. coli needs to eat the sugar lactose are grouped together on the chromosome and are expressed and regulated as a single unit, called an operon. Even more intriguing, the lacI gene that encodes the transcription factor protein Lac Repressor (LacI) that regulates the expression of the metabolic lac genes is located immediately adjacent to the target to which it binds in order to do its job. More recent bioinformatic surveys of the organization of the transcriptional regulatory network of E. coli show that this level of organization is true in general: for at least some classes of regulatory transcription factor proteins (TFs), the genes that encode the TF proteins are found far more frequently near their binding targets than would be expected from a random distribution.
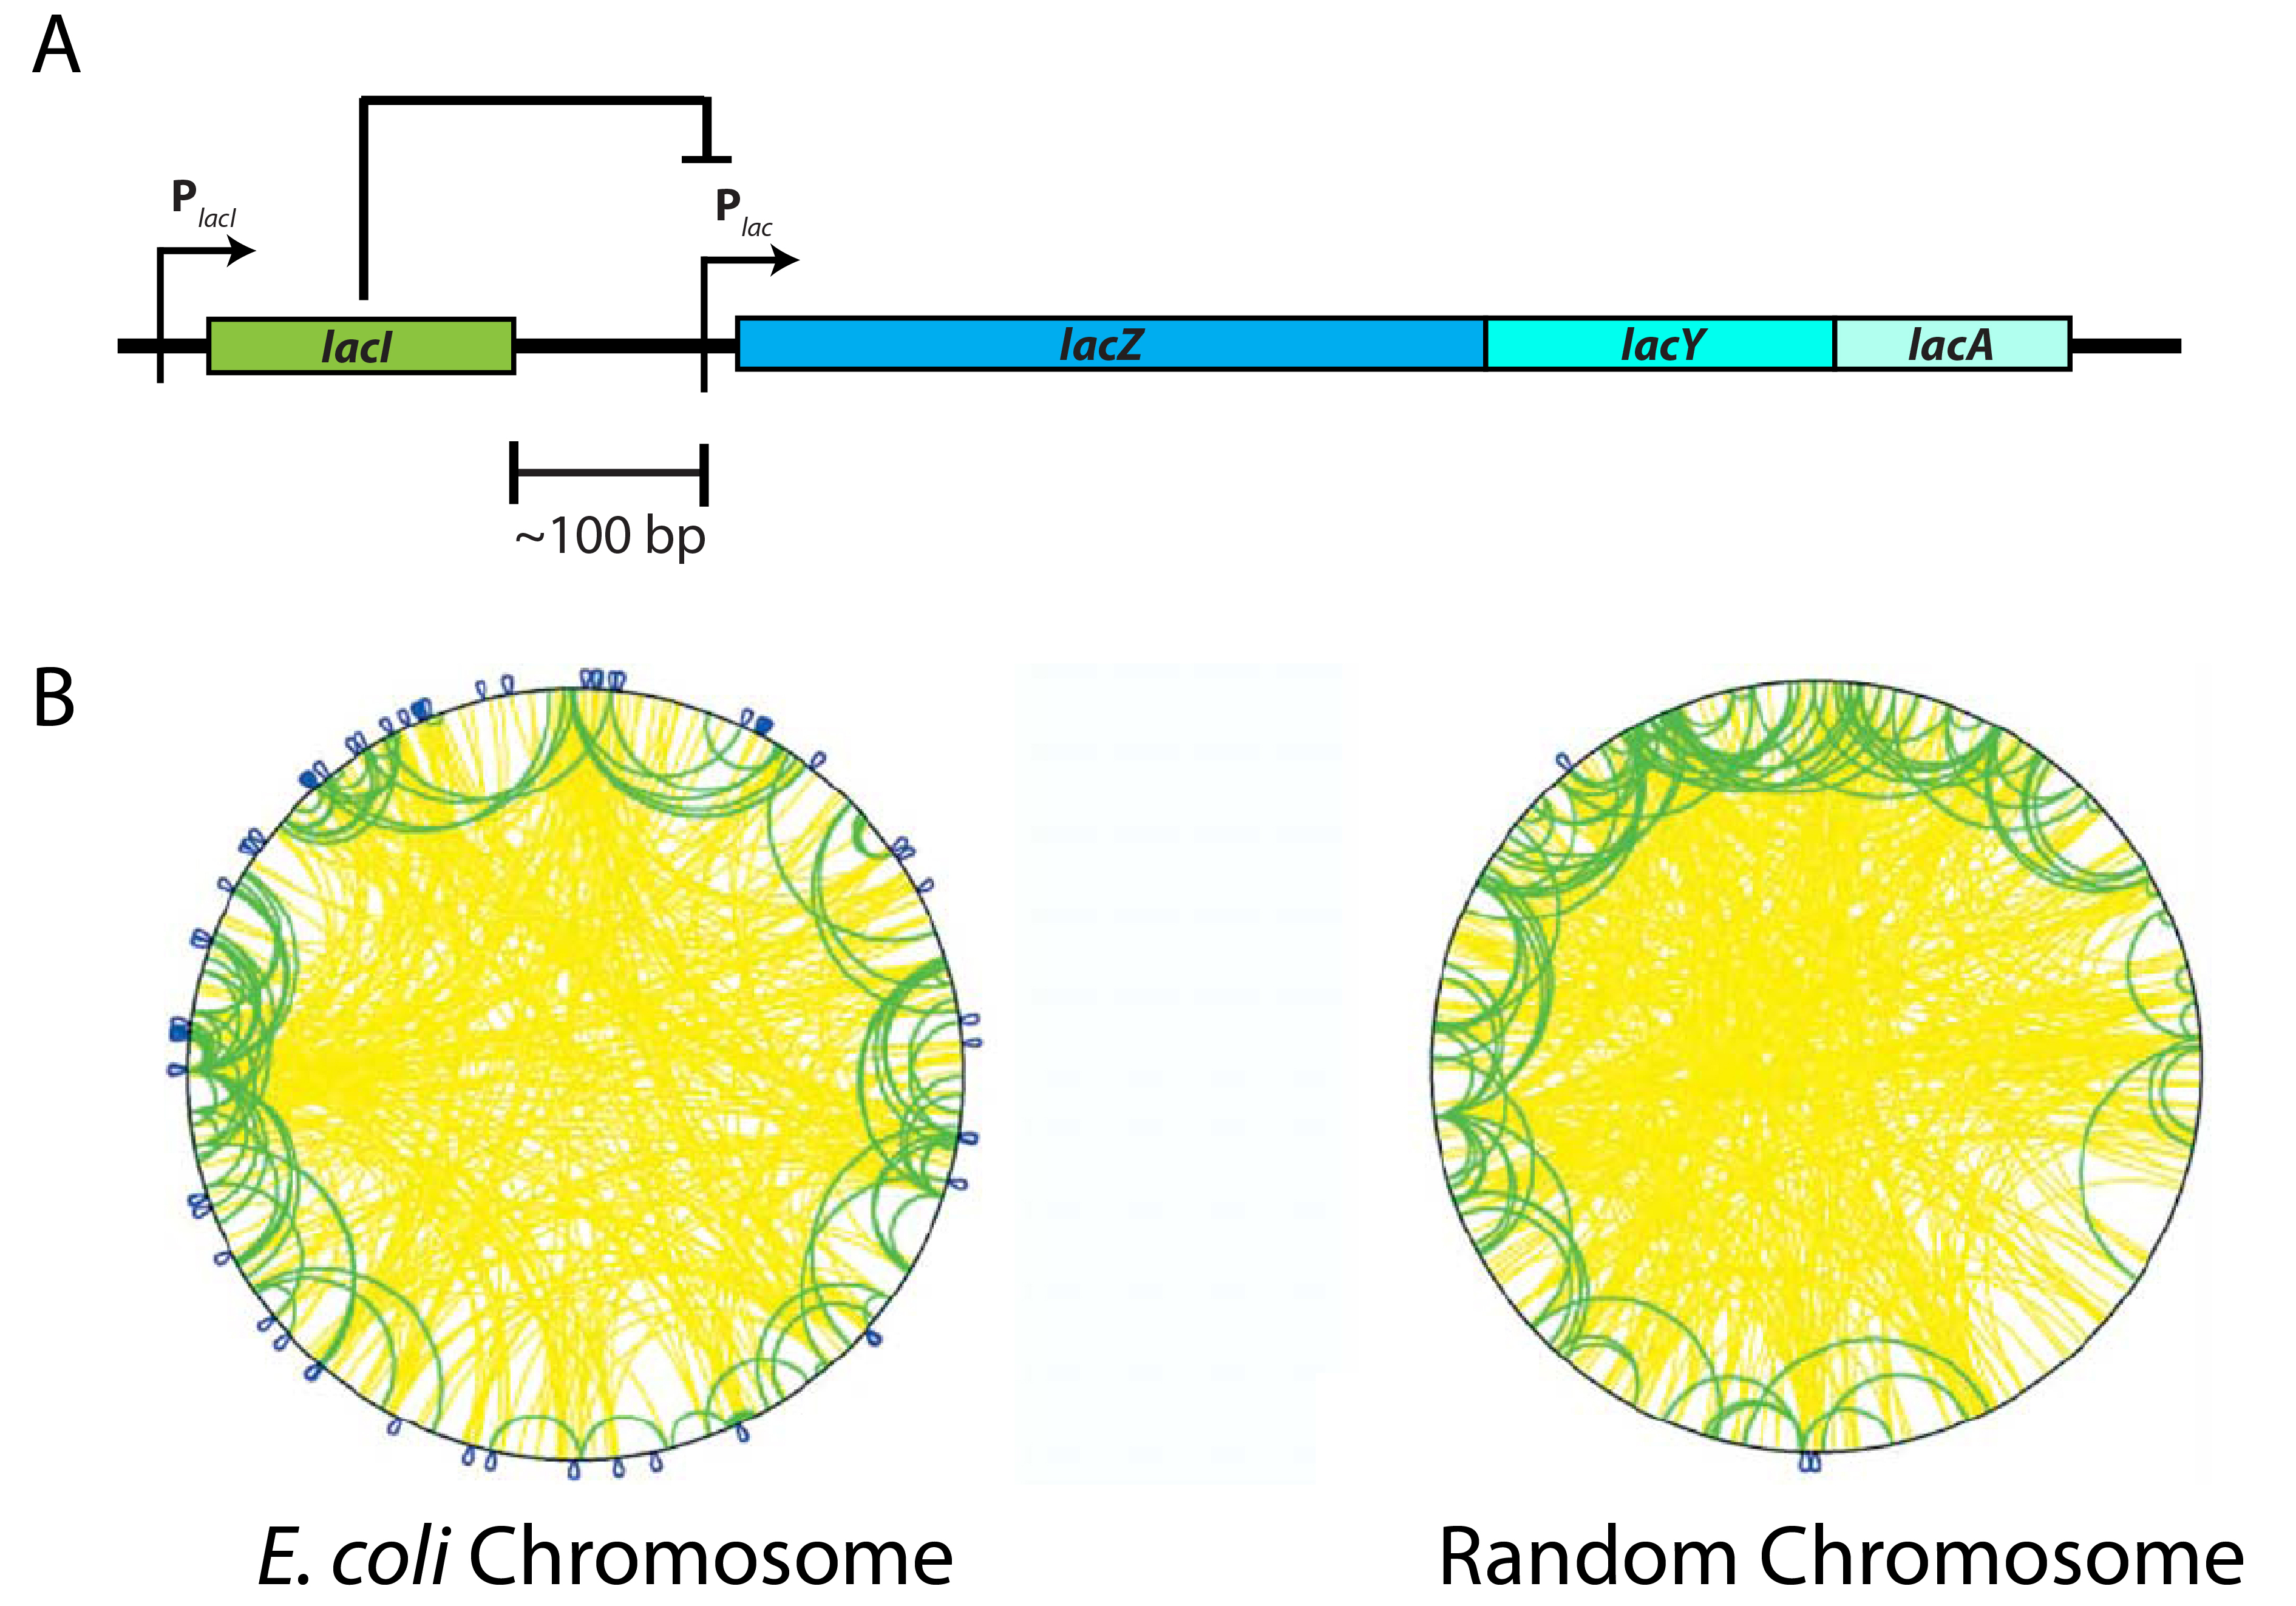
Figure 1: Non-random organization of genes on the E. coli chromosome. (A) The lac operon. The metabolic lac genes (lacZ, lacY, and lacA; blue) required for the cell to eat the sugar lactose are regulated by the product of the lacI gene (green), the Lac Repressor. The lacI gene is immediately adjacent to the metabolic lac genes on the chromosome! (B) Figure 2 from Warren PB, and ten Wolde PR (2004), J Mol Biol, showing the level of organization of genes on the circular E. coli chromosome (left) compared to a chromosome with the same network connectivity, but where the location of the genes is determined at random (right). Each loop corresponds to a pair of regulator/target genes, such as the lacI/lacZYA pair, and the color indicates the genetic distance between the regulator and target genes, s: blue is s < 10 kbp, green is 10 kbp < s < 500 kbp, and yellow is s > 500 kbp. Note that there are many more blue loops in the E. coli chromosome than the random chromosome!
What are the origins of this high degree of organization? Over the years, many hypotheses have been suggested. An example is the Selfish Operon Hypothesis: bacteria can swap and transfer DNA with each other, and if the regulator and target genes are close together they are more likely to be transferred as a single, functional unit than if they are far apart. However, this hypothesis makes testable predictions about the expected organization of the genome, and these predictions appear not to be consistent with observation [Pal C and Hurst LD (2004), Trends in Genetics and Price MN, Huang KH, Arkin AP, and Alm EJ (2005), Genome Res].
Because of the persistant localization of bacterial mRNAs transcribed from chromosomal genes, the majority of Lac Repressor protein will be produced from the location in the cell where the lacI gene resides [Montero-Llopis P et al (2010) Nature and Kuhlman TE and Cox EC (2012) Mol Sys Biol]. The protein then has to find its way from its production site to the location on the genome where it binds, and this search occurs through the physical process of diffusion. It is therefore tempting to think that the colocalization of TF genes with their binding sites would enhance the ability of the regulator proteins to find and bind to their targets.
Figure 2: Diffusion of LacI in exponentially growing E. coli. Bright spots are individual molecules of LacI tagged with the fluorescent protein Venus. This movie is taken at 120x magnification and with 488 nm laser illumination.
As far as diffusion is concerned, however, it is not necessarily obvious that this colocalization would help! For example, the overall distribution of protein throughout the cell will be determined by the rate at which it travels through the cell and its degradation rate. In ground-breaking experiments, Elf J et al (2007), Science measured the intracellular diffusion coefficient of individual LacI proteins to be extremely fast: proteins can get from one end of E. coli to the other in 1-10 s. On the other hand, the degradation rate of LacI is extremely slow, on the order of hours. Because it moves so fast and lives so long, LacI proteins have plenty of time to go everywhere in the cell, and you would therefore expect their average spatial distribution to be homogeneous. In other words, no matter where you put the LacI binding targets relative to the lacI gene, there will always be, on average, the same amount of repressor around to bind to it regardless of its location.
So, from our current understanding of the intracellular diffusion of proteins, you would expect the distribution of LacI to be spatially homogeneous regardless of the location of the gene that encodes the protein. However, we have recently shown that this is not the case at all! The distribution of LacI protein actually depends upon the location of its encoding gene and how densely packed the chromosomal DNA is within the cell. When E. coli runs out of food and begins to starve, it responds by changing its morphology and the packing of its chromosome: the cells get physically smaller, and the DNA gets extremely compact. We have performed ensemble averages of thousands of cells in various growth states and have found that the distribution of LacI and other proteins depends upon the density with which the DNA is packed in the cell. When E. coli are growing quickly, they are fat and happy and the chromosome is spread throughout the cell; measuring the LacI distribution in these cells shows a homogenous distribution of protein throughout the DNA. However, as the cells starve, the DNA gets more condensed and the distribution of LacI shows an increasing correspondence with the distribution of its encoding gene. Moreover, the LacI protein has two "feet" that directly bind to the DNA (the "DNA binding domain"); if we eliminate these feet from the protein, it is no longer attracted to the DNA. Re-measuring the spatial distribution of this non-DNA binding protein in various growth states shows that it shows an increasing tendency to be excluded from highly condensed DNA, until it is finally trapped down at the DNA-free ends of the cell in the starved growth state.
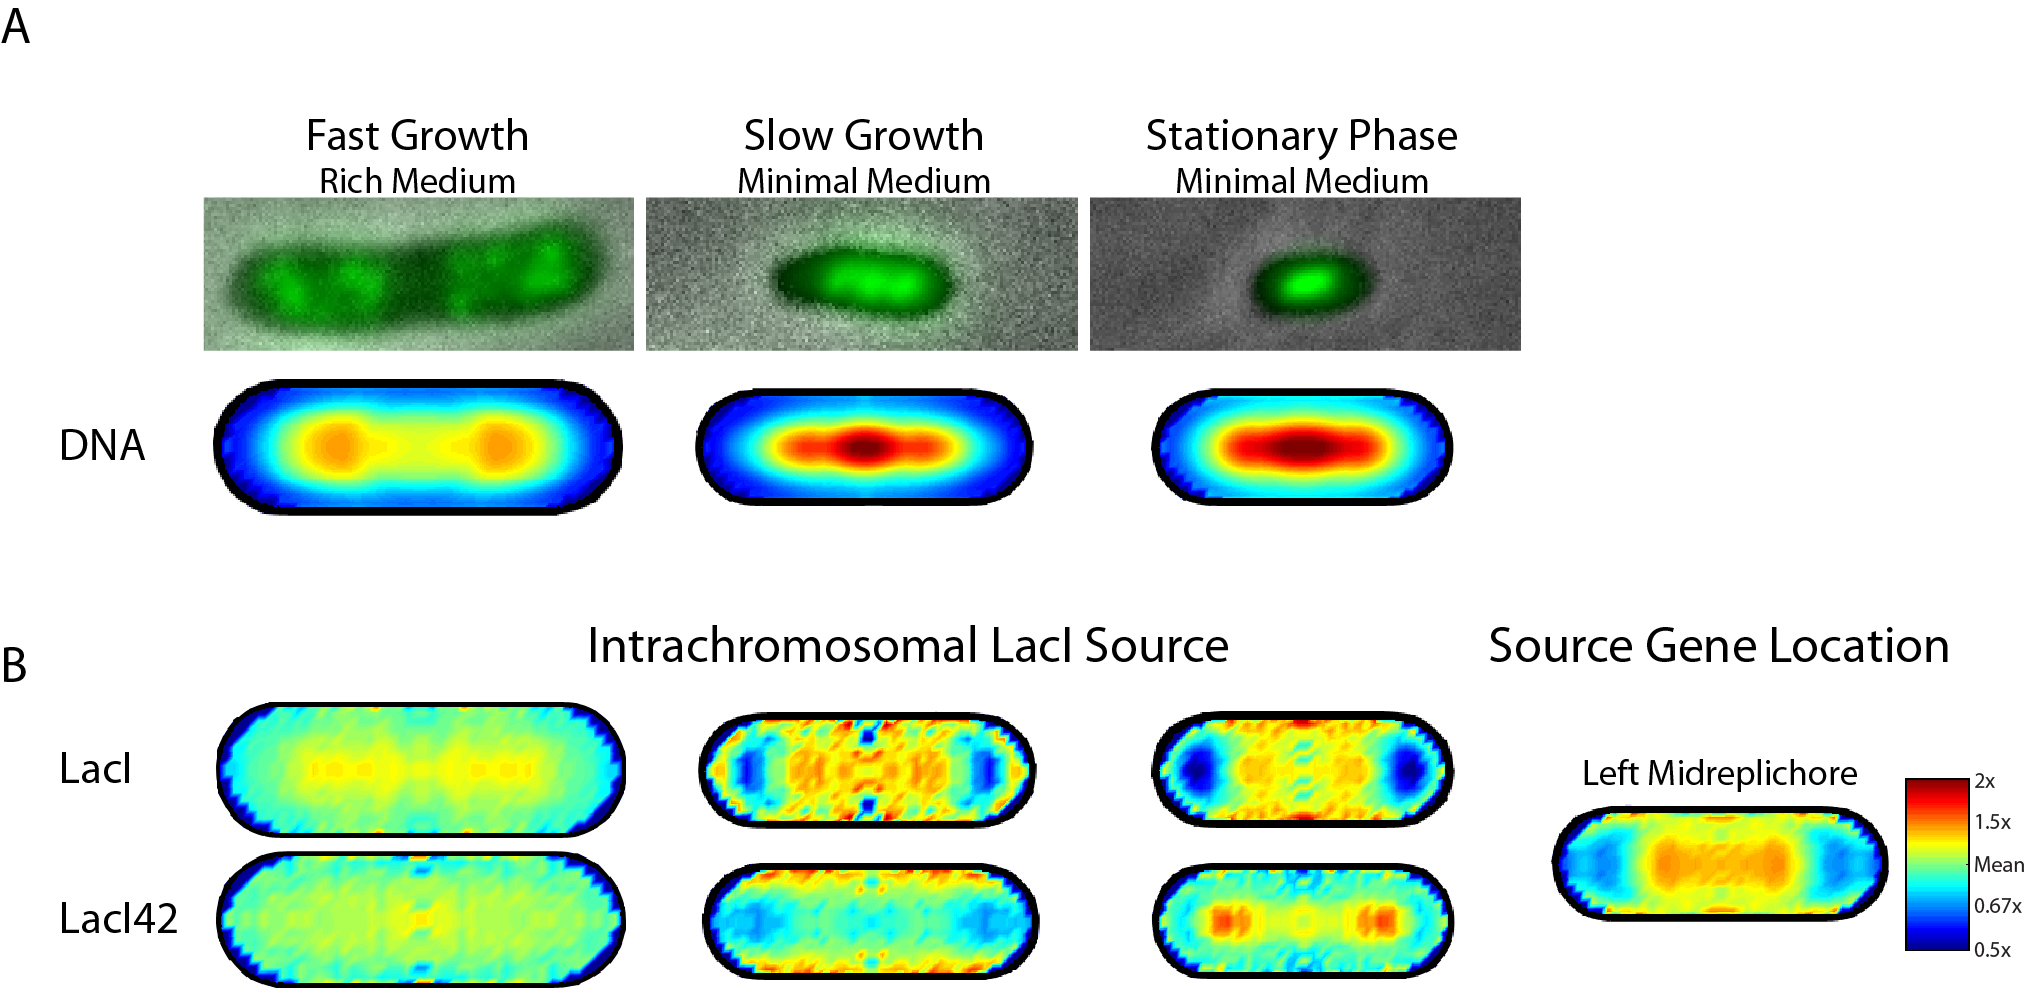
Figure 3: Growth state dependence of the spatial distribution of Lac Repressor protein, LacI. (A) Images of cells grown in different growth states (top); the DNA is stained green. Bottom: the ensemble-averaged distribution of DNA in the cell in each growth state. (B) Ensemble-averaged spatial distribution of LacI protein (top) and LacI protein in which the DNA binding domain has been removed (LacI42, bottom). The average spatial location of the encoding gene in this case is shown in the right-most column. As the growth rate decreases, the spatial distribution of DNA-binding LacI shows an increasing correspondence with the gene distribution.
 Figure 4: Diffusion of LacI42 in starved E. coli. This movie was taken at 400x magnification and with 514 nm laser illumination, which makes the autofluorescence of the cell less bright than the movie in Figure 2. The spots are localized at the ends of the cells as in the starved state in Figure 3. Compare the rate and extent of LacI diffusion in this movie to that in Figure 2!
Given the previous argument about LacI diffusion and degradation rates, how are we to understand this non-homogeneous distribution of protein? We propose that diffusion within the cell can be thought of as diffusion within and exchange between two distinct phases: the chromosomal DNA that makes up the nucleoid, and the DNA-free cytoplasm. We think it is the fundamentally different nature of the diffusive kinetics within these two phases that drives the spatial distribution of protein (see Intranucleoid Diffusion Kinetics).
Does this inhomogeneity of LacI protein in slow growth states affect the regulation of genes? It appears that the answer is yes! Using our tools for genome modification (see In vivo Genome Manipulation), we have created lots of bacteria strains in which the regulator and target genes are different physical and genomic distances away from each other. Then, by measuring the output of the regulated gene as a function of regulator/target intergenic distance, we can see whether or not the repression strength in the local vicinity of the lacI gene is stronger than you would otherwise expect from a homogeneous distribution of protein. In the slowest growth state we've measured so far, the enrichment of LacI protein in the vicinity of its encoding gene is observable as a weak 1.5-2x fold enhancement of repression strength when the target is close to the lacI gene!
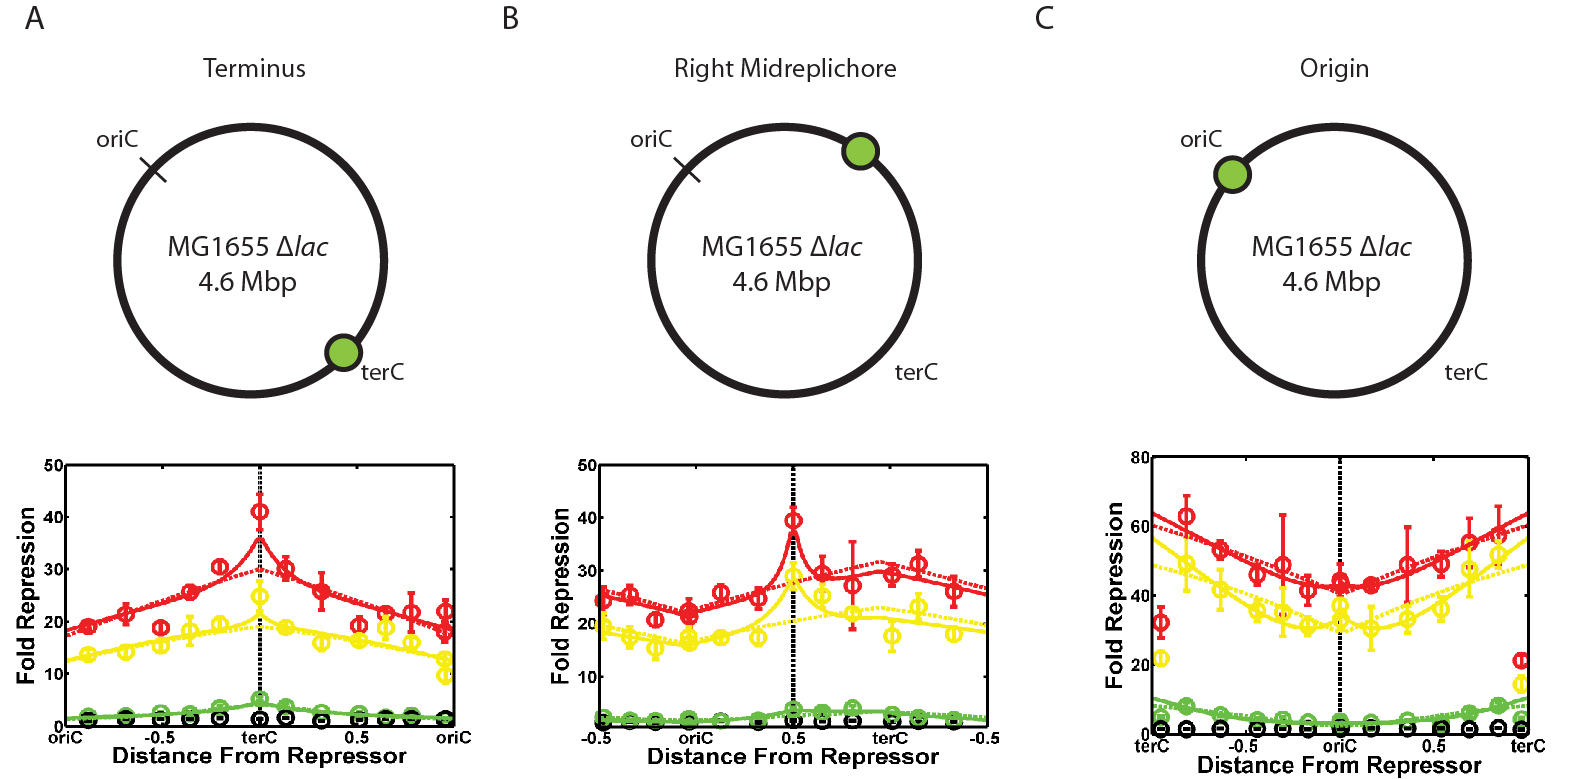
Figure 5: Dependence of repression strength on regulator/target intergenic distance. Plots are shown for when the lacI gene is integrated near the terminus of replication (A), the middle of the right-hand side of the chromosome (B), and near the origin of replication (C). Different colored curves are for different growth rates: Green - fast growth (20 min doubling time), yellow - medium growth (~60 min doubling time), and red - slow growth (120 min doubling time). Black points are a control in which the inducer IPTG has been added to eliminate all repression. The spike in repression strength is most obvious in the red curves of (A) and (B).
Our results seem to indicate that the diffusion of repressor protein in the cell is dramatically different when the cell is starving and the intracellular environment is highly crowded than when the cell has plenty of food. Consequently, the distribution of protein in this starved state is concentrated around the encoding gene, which enhances the strength of gene regulation when the regulator and target genes are spatially close to each other. We are currently testing whether this and related phenomena are sufficient to drive the observed organization of bacterial genomes.